Posts: 2,010
Threads: 65
Joined: 07/2013
(2020-03-06, 18:31)mwaters Wrote: (2020-03-06, 16:16)cutty Wrote: past wk
Wow! How much of that was done in a graphics editing program? I'd like to see my stations automatically displayed on the same page like this!
Like This?
https://frankfortweather.us/frankfortblitz/
Posts: 1,294
Threads: 45
Joined: 05/2017
2020-03-07, 00:13
(This post was last modified: 2020-03-07, 21:15 by mwaters.
Edit Reason: Added last paragraph
)
Thanks! That looks easy enough.
EDIT: Since I don't have a web server right now, I just have 1977 and 2294 in two different browser tabs, and just switch between the two.
Posts: 2,010
Threads: 65
Joined: 07/2013
I'm fiddling with a rather confusing 'one stop' page to monitor and control my three stations from a single webpage, but will work great for a single station, also, which currently looks like the video below.
I'll get around to making active in both public and private formats soon, hopefully, with templates, ideas... bear with me... it's complex for an old guy like me who doesn't speak PhP or other such languages... heh...Quick Look here:
Video Overview
Cheeers!
Mike
Posts: 657
Threads: 5
Joined: 11/2017
(2020-04-01, 14:19)cutty Wrote: I'm fiddling with a rather confusing 'one stop' page to monitor and control my three stations from a single webpage, but will work great for a single station, also, which currently looks like the video below.
I'll get around to making active in both public and private formats soon, hopefully, with templates, ideas... bear with me... it's complex for an old guy like me who doesn't speak PhP or other such languages... heh...Quick Look here:
Video Overview
Cheeers!
Mike
Mike, excellent, good job so far.
Dries
Posts: 356
Threads: 11
Joined: 07/2014
really nice 
Posts: 179
Threads: 35
Joined: 03/2020
Hi Mike
Will you be sharing the code for others to use? Very new to all this.
Many thanks
Chris
Posts: 337
Threads: 35
Joined: 12/2017
Hello Egon,
I've two questions to statistics_2b.
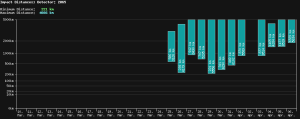
1) Would it be possible to show distances beyond 5000 km in the diagram?
2) The minimum distance printed top left of the diagram matches with the bars. The maximum distance in the bars shows higher values than the one printed top left. What is the meaning of the maximum distance and why is there a difference?
Klaus
Posts: 917
Threads: 55
Joined: 06/2012
2020-04-07, 15:37
(This post was last modified: 2020-04-07, 21:20 by Egon.)
Hi folks,
the minimum and maximum distance now relates to the days displayed. I'm sorry about the bug.
The distance scaling can now be set individually, but it remains exponential to the exponent 1/2.The scaling can now be set individually, but it remains exponential to exponent 1/2. The specified values must be greater than 0, ascending, and separated by commas.
Here is an example with distance_labels=10,50,200,500,2000,5000,10000:
https://map.blitzortung.org/statistic_2b...5000,10000
with labels_extension=1 the last label is the maximum of the last label and the maximal distance.
https://map.blitzortung.org/statistic_2b...xtension=1
Further suggestions for improvement are welcome. I am currently working on a direction image for the received signals of lightning strikes.
I have moved the scripts statistic_1b.php and statistic_2b.php to statistic_1.php and statistik_2.php, even if the new database only contains 13 days now.
/Egon
Posts: 337
Threads: 35
Joined: 12/2017
Hello Egon,
thanks for the quick response and the highly appreciated new diagrams.
Klaus
Posts: 917
Threads: 55
Joined: 06/2012
2020-04-09, 15:53
(This post was last modified: 2020-04-09, 15:54 by Egon.)
Hi folks,
here are two small changes for statistic_1.php
1.) With time_zone (-11 to 12) the time scale can be adapted to the local time. Currently 2 for Europe. Please no discussions about Daylight saving time. In Europe, the time change will be abolished next year anyway.
2.) On special request, the background color can be set to transparent with background_transparent = 1.
statistic_2.php will also be adjusted to the time_zone parameters in the next few days.
/ Egon
Here is an Example:
https://map.blitzortung.org/statistic_1....ime_zone=2
|







![[Image: NOAARADlogoTXT80.png]](https://noaaweatherradio.org/icons/NOAARADlogoTXT80.png)