2017-05-19, 23:38
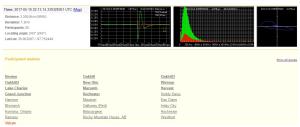
I am a new user for 3 days now. I notice that a few of my reporting waveforms and spectrum plots are what I would call "very smooth" compared to most reports from my station and all other stations that I have viewed. The system seems to be receiving and using these observations, as well as my more "normal" waveforms for calculations. Can anyone explain these beautiful, but odd waveforms? They only seem to show up at a range of 3,000 km to maybe 3,300 km ... very strange.
I have attached a screen shot of a report. -Or- they show up often enough that you should be able to view them: Station 1838 in Volcan, Panama. Thanks for any information that you can give me.

I have attached a screen shot of a report. -Or- they show up often enough that you should be able to view them: Station 1838 in Volcan, Panama. Thanks for any information that you can give me.
Stations: 1838


