Posts: 7
Threads: 2
Joined: 04/2017
I am a new user for 3 days now. I notice that a few of my reporting waveforms and spectrum plots are what I would call "very smooth" compared to most reports from my station and all other stations that I have viewed. The system seems to be receiving and using these observations, as well as my more "normal" waveforms for calculations. Can anyone explain these beautiful, but odd waveforms? They only seem to show up at a range of 3,000 km to maybe 3,300 km ... very strange.
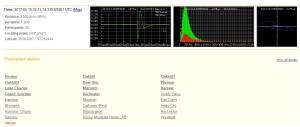
I have attached a screen shot of a report. -Or- they show up often enough that you should be able to view them: Station 1838 in Volcan, Panama. Thanks for any information that you can give me.
Posts: 149
Threads: 26
Joined: 06/2014
2017-05-20, 05:46
(This post was last modified: 2017-05-20, 14:24 by BobW.
Edit Reason: spelling errors
)
So I'm going to start with "I don't have all the answers"....
It appears that the really smooth waveforms are something relatively local to you, and are not due to lightning. The system appears to "think" that some of the pulses are related to lightning strikes, but it's really just coincidence. Look at the time offset on some of your detected strokes. It's many 1000's of microseconds. The pulse fits a stroke that occurred somewhere, but isn't related. Alot of this really is guessing that a timed pulse that's within a window is related. Look at some other stations and yours with some closer strokes. The time offset is much lower. The matches probably occur during heavy lightning periods like tonight in the US. That way, one of the observed pulses has a bigger chance of fitting a window.
Another way to make sense of this. You're in Panama, so I don't know if you do miles or meters, so you may have to convert....
Say there's a single lightning strike exactly 2 miles away. 10 seconds later you hear thunder. (speed of sound is 1100 feet per second, 5280 feet in a mile, so 5 seconds = 5500 feet, or pretty close to a mile)
So now say there's two equally bright lightning strikes that happen about 5 seconds apart. You don't know it, but the first one was 4 miles away, and the second is 1 mile away. 10 seconds after first flash, you hear thunder. 10 seconds later you hear another thunder - pretend it's loud also. So, Do you assume that the first thunder you hear is from the first flash, and the second is from the second flash and calculate the distances accordingly? Two miles for the first flash, because it was 10 seconds flash to bang, and the second flash at 3 miles because it's 15 seconds flash to bang for second flash?
As you can see, if there's occasional lightning with enough gaps between them, you can accurately distance - but not locate - them based on time of arrival of thunder. Put lots together, and it gets difficult. Now think in terms of the zap to pulse received in terms of the microseconds, or low milliseconds that this system has to deal with.
So, how to locate the source of your noise? You can rotate your antenna so you get peak on one channel, and null on the other, The source is then in either of the two directions of the peak loop. It might be interesting to look directly at the waveform page on the controller with the "squelch" disabled. There may be a pattern to the pulses not otherwise visible.
And, I'm sure that there's others that can explain this much better.
Posts: 520
Threads: 18
Joined: 06/2016
I like that variable distance from events resulting in the observations of the events getting jumbled. Something I hadn't twigged about a real world TOA system...
They are a strange signal but the spectrum plot reflects the impulse so I'd say they are real. As a check do they stop if you short the head amp loop inputs? How is the H-field head amp connected to the loops?
The other thing to note is that they are *BIG* signals, I've seen the peaks clipped off at something over 2.4 V peak to peak. The Y scale on many plots automatically scales itself to the size of the impulse, so what appears to be a similar sized signal can actually be very different. The fourth Y marker away zero on your plots varies from 0.08 V to 1.2 V. These "smooth" signals vary in amplitude from only occasionally 0.6 V P to P to overloading the amplifier at > 2.4 V P to P. Most "normal" signals are less than half that minimum, 0.16 to 0.3 V P to P.
As BobW says watch the "noise floor" display on the receivers Signals page and see if there is any sort of pattern or regular repetition. If they aren't very frequent getting a bearing from a loops null might be rather time consuming. On my 30 cm 20 turn loops the null is very deep but also very narrow. A tiny rotation, just a degree may be two, can take you from one side of the null to the other and with the amplitude varying anyway...
They look like switching impulses but can't think of anything that switches a fair amount of power (due to the signals size, unless it's very close) at what appears to be tens of seconds or a minute or two intervals.
Cheers
Dave.
Stations: 1627
Posts: 149
Threads: 26
Joined: 06/2014
"Something I hadn't twigged about"
Ok... Had to get the Brit to Yank translator out for that one!
So , watching the page on LMO, those pulses happen pretty frequently, so loop peak / null should be able to do it. It looks like they center around 10khz. Dog collar fence, electric fence, lawn mower loop? Power line comms?
Posts: 178
Threads: 22
Joined: 01/2014
2017-05-21, 09:44
(This post was last modified: 2017-05-21, 10:03 by kriu.)
(2017-05-19, 23:38)hp3ak2 Wrote: I am a new user for 3 days now. I notice that a few of my reporting waveforms and spectrum plots are what I would call "very smooth" compared to most reports from my station and all other stations that I have viewed....
This signal certainly does not come from lightning. This is a disturbance from a nearby electrical appliance. Do these types of signals appear in series a dozen or several dozen signals per seconds?
Besides, your stations capture extremely a lot of bad signals and only a small percentage of them really are from lightning.
I suggest to significantly reduce the gain - 2-3 times. The amount of sending signals to the server should not exceed 20,000 per hour during a strong storm and 3,000 per hour during a period of low storm activity. You will see that the amount of correct detected signals from the lightning does not decrease significantly.
Posts: 520
Threads: 18
Joined: 06/2016
2017-05-22, 10:47
(This post was last modified: 2017-05-22, 11:25 by allsorts.)
(2017-05-21, 05:32)BobW Wrote: "Something I hadn't twigged about"
Ok... Had to get the Brit to Yank translator out for that one!
Whoops, sorry. "Something that hadn't occured to me before".
(2017-05-21, 05:32)BobW Wrote: So , watching the page on LMO, those pulses happen pretty frequently, so loop peak / null should be able to do it. It looks like they center around 10khz. Dog collar fence, electric fence, lawn mower loop? Power line comms?
My turn. "LMO"?
<strike that- LMO the onlilne version of the PHP MyBlitzortung that you can run on your own server>
Doesn't that just cycle through the last dozen or so signals showing each one for a few seconds. Without looking at the time stamps you don't know if those dozen or so signals cover an hour or a minute...
The Archives > List might be a better place to look at the signals. Being static you get a chance to look at them properly. Just spotted some that have that auto scaled Y axis at 2 V! Another feature is many signals have an "echo" approx 250 us after the main signal. 250 us is about 75 km at light speed in free space or 60 km in a cable. I can't imagine what in the world could cause a real, measureable, signal with path length distance difference of 75 km. Unless VLF is reflected by one of the ionosphere layers? But the "echo" is fairly consistent in being 250 to 300 us and it shows on small (100 mV PtP) and the massive 2 V PtP signals.
I doubt the head amp to receiver cable is 60 km long but I'd have a good look at the termination of the screened plugs to screened cable. The cable/plugs I used needs the cables screen drain wire soldering to the plugs screen. There is also something you do (or maybe don't do!) with the input side of each channel of the H-field head amp when using loops. Bridge (or not) a couple of solder pads.
Cheers
Dave.
Stations: 1627
Posts: 149
Threads: 26
Joined: 06/2014
This is updated every couple of seconds. Gives some indication of what's being observed and how frequently. They don't repeat, and the time stamps only move forward, and should be close to current time if station is being triggered frequently.
https://www.lightningmaps.org/blitzortun...o_sid=1838
Posts: 45
Threads: 6
Joined: 02/2016
Has it been established that the source of the signals is actually external to the unit? Do they disappear when the antennas are disconnected? It isn't beyond the realms of possibility that they are actually internally generated signals caused by a fault condition.
Posts: 178
Threads: 22
Joined: 01/2014
2017-05-22, 20:30
(This post was last modified: 2017-05-22, 20:36 by kriu.)
To hp3ak2:
Take Laptop and connect your station to the USB (power) and LAN (network) in laptop.
Set up IP addresses on your laptop and station from the same domain.
Disconnect your all entire network of power energy at home and nearby.
Observe then the signals received by your station.
Posts: 7
Threads: 2
Joined: 04/2017
(2017-05-22, 20:30)kriu Wrote: To hp3ak2:
Take Laptop and connect your station to the USB (power) and LAN (network) in laptop.
Set up IP addresses on your laptop and station from the same domain.
Disconnect your all entire network of power energy at home and nearby.
Observe then the signals received by your station.  Very good and detailed advice. I will try that. It will be a good way to get isolation from the house power & other potential noise.
Thanks to all who have made suggestions and offered advice. ** I believe that I have determined the following at this point with my system Red:
- The signals occur at approximately one second intervals, with some gaps. This is identical in behavior to the electric cattle fences nearby in my shortwave receivers.
- They are very strong compared to other signals being received, 1.2v / .23v (Equivalent of kilometer long transmitting antennas, 1/2 km distant.)
- Slowly rotating my 1m crossed loops will null the signal in one channel, while maximizing it in the other channel. I can make either channel very strong while making the other quite weak, or I can make both about equal, but very strong. It does not appear that moving the antennas, within this neighborhood, will do any good at all.
- The blitzortung computers usually ignore these when sent; however, some of them are close enough in time stamp to be processed.
- I have tried turning on the filters and setting the sensitivity back in each channel. However, the signals are just too strong.
- Since most of the energy is from 5 to 40 kHz, I don't believe that there is a practical way in which to filter it out. Suggestions?
I have been unable to locate a good set of instructions on manually setting up the gains, triggers, etc. in the forums. ??
|